Math · Built from a recipe
Graph Plotter
D4 on the major comb. Its drum rings at 285.0 Hz.
A graph turns an equation into a picture.
- Shelf
- Math
- Kind
- Built from a recipe
- Your own
- Your own curve
- Sound
- Yes
- Licenses
- Own work (made in the page)
Its note
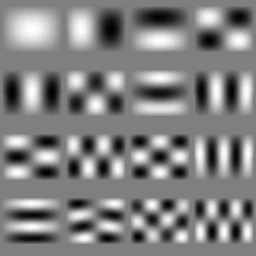
Splashery stretches a drumhead over this Splash's outline, twelve inches across, and finds the ways it can ring. Its lowest is 285.0 Hz, 52 cents flat of D4, the nearest tine on the comb. The next fifteen are its overtones, and each one draws its own figure: sand gathers on the lines that stay still.
- 1285 Hz
- 2416 Hz
- 3483 Hz
- 4570 Hz
- 5571 Hz
- 6691 Hz
- 7697 Hz
- 8734 Hz
- 9760 Hz
- 10832 Hz
- 11855 Hz
- 12902 Hz
- 13916 Hz
- 14964 Hz
- 15972 Hz
- 16983 Hz
How to play
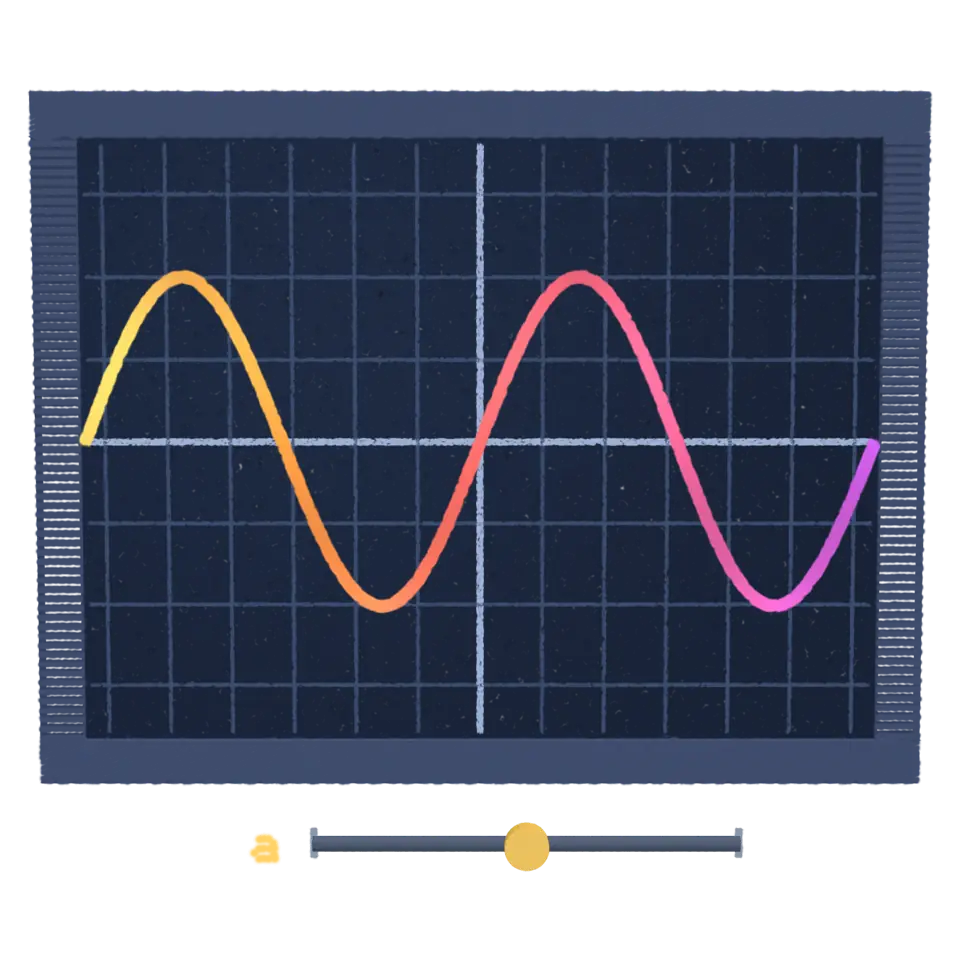
Tap to draw the curve. Pick a curve, or type your own, in the Splash tab.
Its controls
| Control | Kind | Range | Start |
|---|---|---|---|
| Draw it | Tap | ||
| a | Slider | 0 to 100% | 50% |
| Draw | Button | ||
| Curve | List | 43 choices | Sine wave |
| b (your own curve) | Setting |
About it
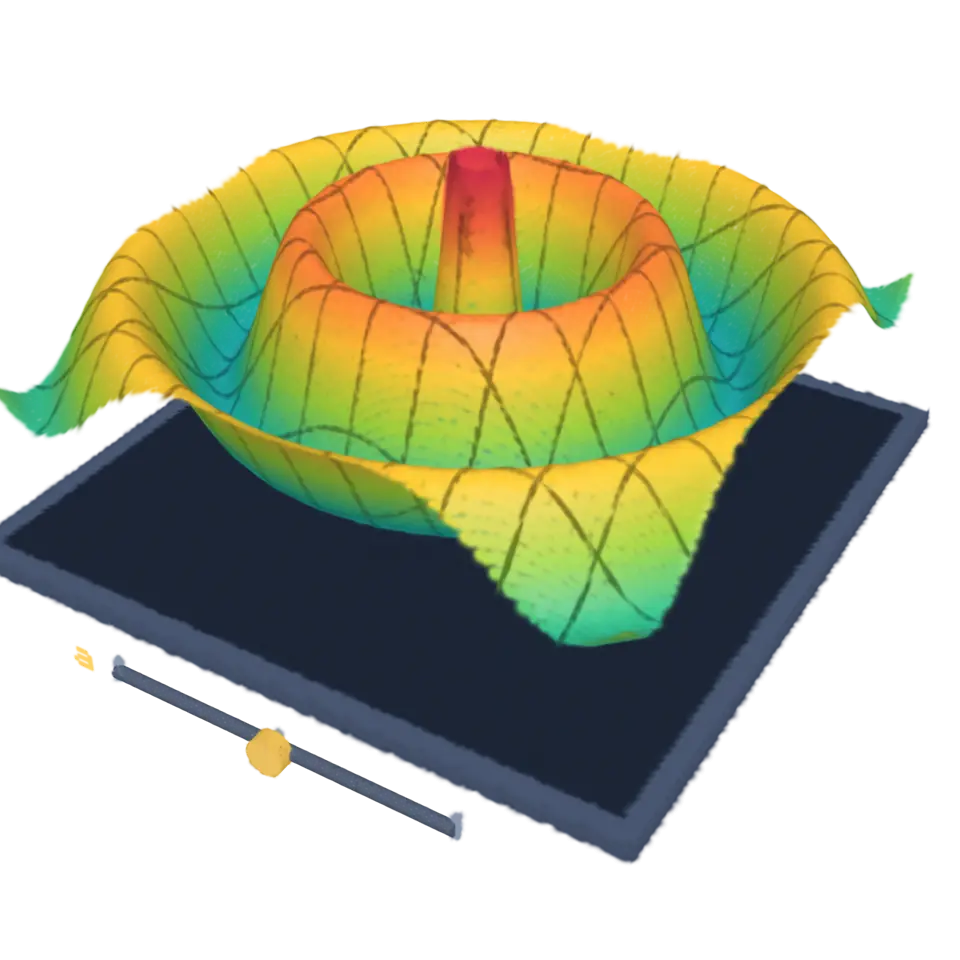
A graph turns an equation into a picture. For y = x², every x along the bottom gets a height y, and joining them draws a curve. René Descartes wrote about this kind of grid in 1637. Curves can be drawn other ways too: by distance and angle (polar), or by following a moving point over time.
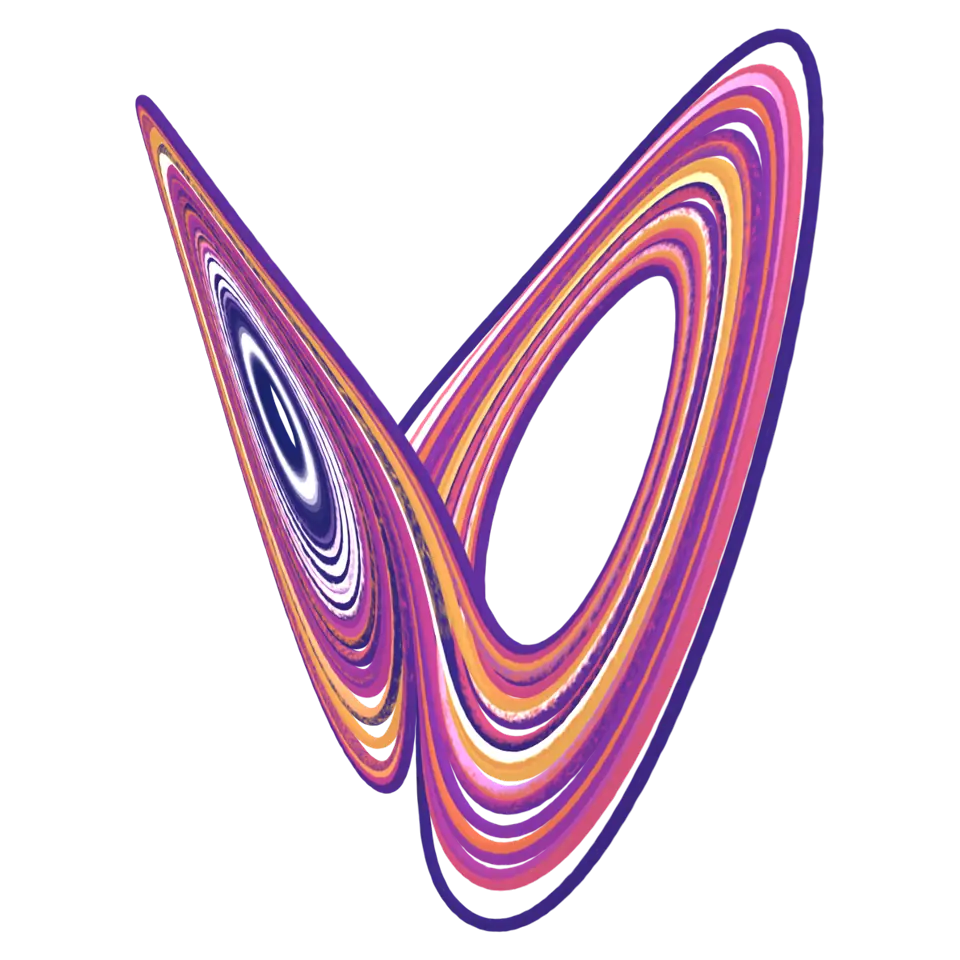
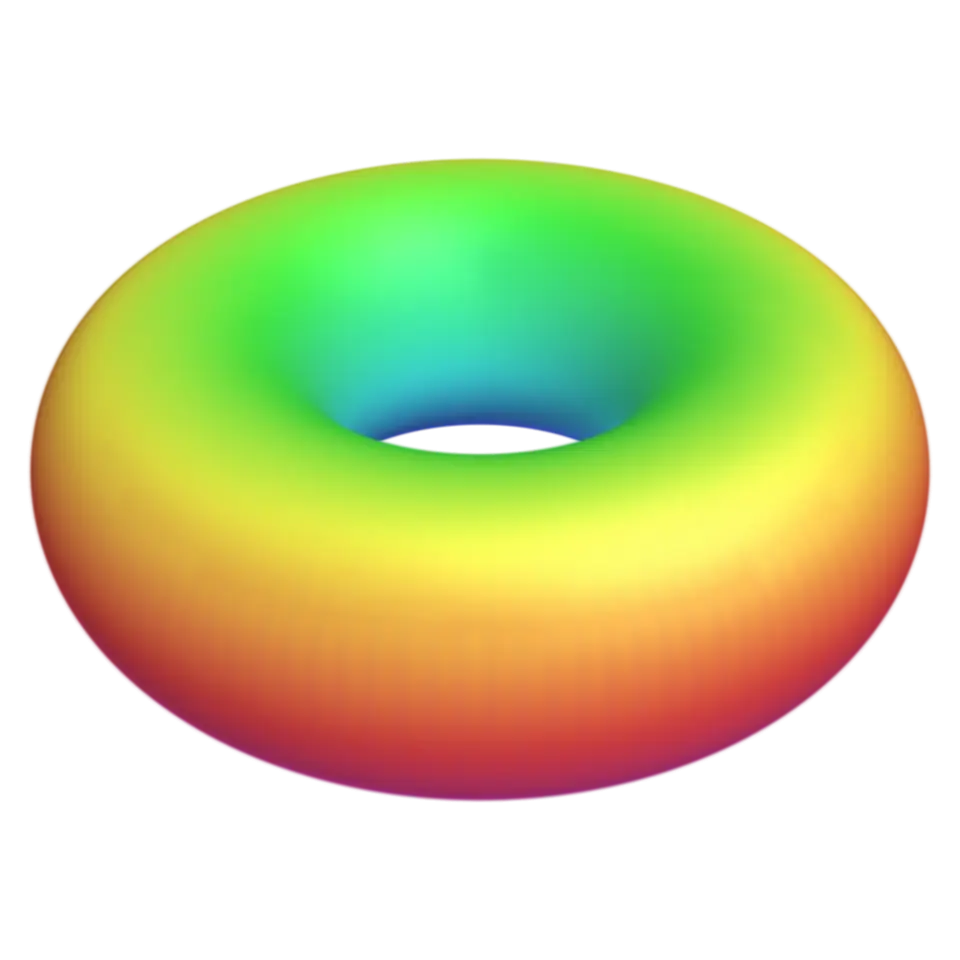
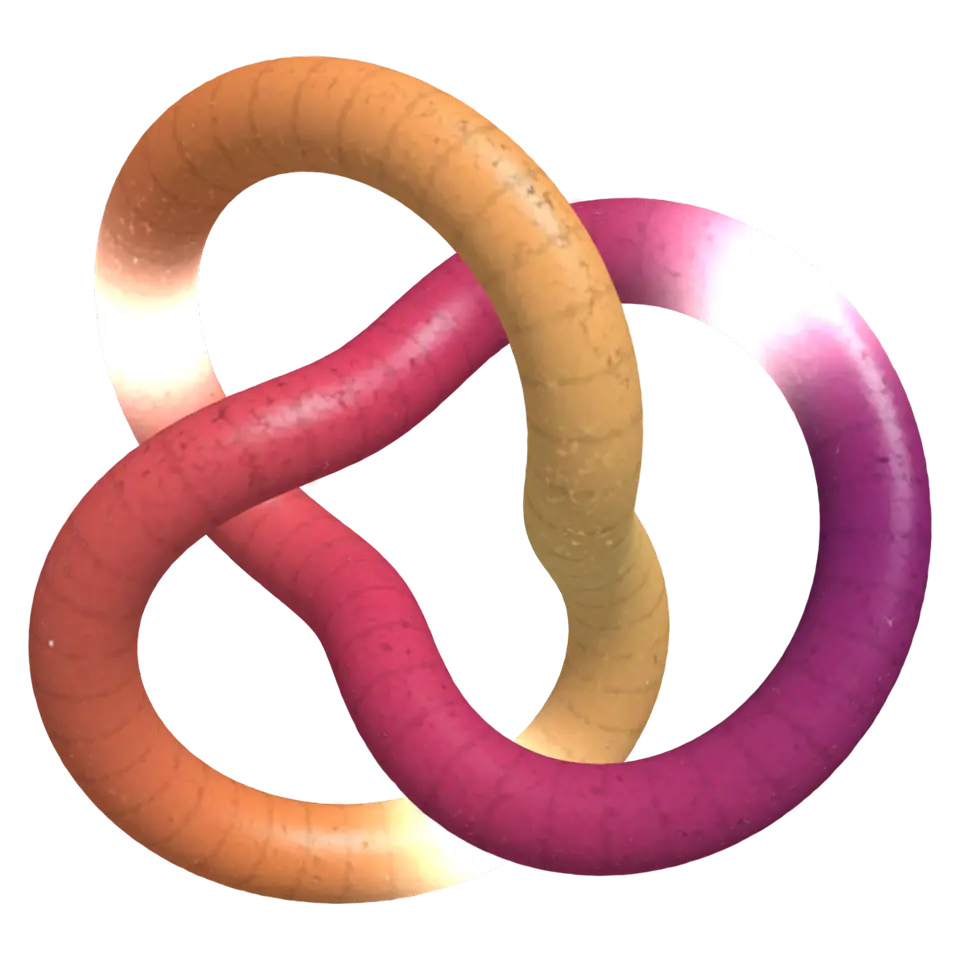
Tap it and a pen draws the curve across the grid, humming a note that follows its height; then the a slider sweeps and the curve bends with it. Pick one of 42 famous curves in the Splash tab, or type your own: y = … with x, r = … with θ, or x = …, y = … with t. Put a in it to see it bend.
Details
- Splats
- Opens at 200,000 at Mid Detail, 72,000 at Low, and up to 690,000 at Max
- Your own files
- .txt
Sources and credits
Made in Splashery. Its code is MIT.